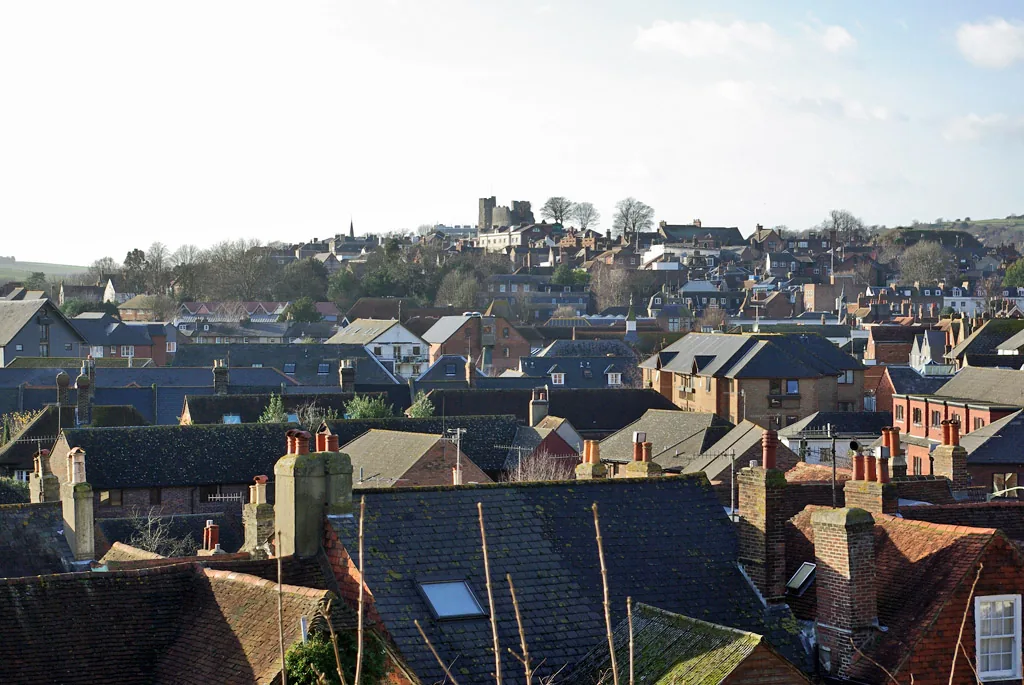

The average Lewes district home sold for £370,799 in May 2026, up 2.5% while East Sussex fell 1%. Median sold prices for all 13 neighbourhoods.
The average home in the Lewes district sold for £370,799 in May 2026, the most recent month in the official UK House Price Index. That is up 2.5% over twelve months, at a time when East Sussex as a whole fell 1.0%, Eastbourne fell 3.8% and Brighton and Hove fell 1.4%. Among the districts around it, Lewes is the one going up.
The district average is also the least useful number on this page, because this is not one housing market. It is a county town inside a national park, three coastal towns that were built for very different reasons, and a strip of Low Weald villages. Land Registry sold prices put the median in Lewes West at £535,000 and the median in Seaford Town at £280,000. Both are in the same district, eleven miles apart.
The district average, and what moved
These are the mix-adjusted figures for the Lewes local authority in May 2026, from the UK House Price Index, which is built from completed Land Registry sales rather than asking prices.
| Property type | Average price | Change over 12 months |
|---|---|---|
| All property types | £370,799 | +2.5% |
| Detached | £597,117 | +3.2% |
| Semi-detached | £401,084 | +3.8% |
| Terraced | £324,956 | +2.8% |
| Flat or maisonette | £199,675 | −0.8% |
Houses rose and flats slipped, which is the pattern across most of the South East right now. The semi-detached figure moved most, up 3.8%, and that is the type the coastal towns are largely made of. The flat figure matters more here than in most districts, because Seaford and Newhaven between them hold a lot of purpose-built retirement flats, and that is the one category not recovering.
Median sold price by area
The UK House Price Index only publishes down to the whole local authority. Below that, the Office for National Statistics publishes median sold prices for the 13 neighbourhoods that make up the district, using the same Land Registry records. These are medians, so one large sale cannot move the figure, and they cover the twelve months to September 2025.
| Neighbourhood | Median sold price | A year earlier |
|---|---|---|
| Lewes West | £535,000 | £555,000 |
| Wivelsfield Green, Ditchling & Rodmell | £497,500 | £552,500 |
| Chailey, Newick & Barcombe | £475,000 | £523,000 |
| Ringmer, Glynde & South Heighton | £453,250 | £410,000 |
| Lewes Central & East | £420,000 | £390,000 |
| Seaford Eastbourne Road | £415,000 | £419,995 |
| East Saltdean & Telscombe Cliffs | £390,000 | £360,000 |
| East Blatchington | £387,500 | £400,000 |
| Peacehaven West | £350,000 | £339,995 |
| Peacehaven East | £350,000 | £349,998 |
| Newhaven West | £298,000 | £294,000 |
| Newhaven Town | £297,500 | £305,000 |
| Seaford Town | £280,000 | £265,000 |
Three things come out of that list.
The dear end is inland, not on the coast. Lewes West, the Wivelsfield Green and Ditchling belt, and the Chailey, Newick and Barcombe villages take the top three places. All three sit inside or against the South Downs National Park, where new building is tightly constrained, and all three fell over the year. The Wivelsfield Green area dropped £55,000 and Chailey, Newick and Barcombe dropped £48,000. Thin, expensive village markets move in lumps.
The coastal towns rose while the villages fell. Seaford Town, East Saltdean and Telscombe Cliffs, Peacehaven West and Newhaven West all put on money over the same twelve months. Ringmer, Glynde and South Heighton rose most in cash terms, up £43,250. The gap between the two ends of the district is closing, not widening.
Seaford Town’s £280,000 is not the price of a house in Seaford. It is the price of the typical sale in Seaford Town, and a large share of those sales are flats. Look at the same neighbourhood by property type and a detached house has a median of £525,000, a semi £365,000 and a terrace £302,500, while flats sit at £200,000. Seaford has a lot of purpose-built retirement flats and they trade often. If you are buying a house there, the flats median is not your number.
| Neighbourhood | Detached | Semi | Terraced | Flat |
|---|---|---|---|---|
| Lewes Central & East | £1,202,500 | £536,500 | £485,000 | £257,500 |
| Lewes West | £762,500 | £541,000 | £600,000 | £202,500 |
| Seaford Town | £525,000 | £365,000 | £302,500 | £200,000 |
| Peacehaven East | £405,000 | £367,950 | £315,250 | £238,000 |
| Newhaven Town | £363,000 | £325,000 | £275,000 | £190,000 |
The Lewes Central and East detached median of £1,202,500 is the single most extreme figure in the district, and it comes off a small number of sales in a conservation-area town centre where detached houses barely come up. The terraced figure in Lewes West being higher than the semi-detached figure is the same effect in reverse: the terraces there include the Georgian frontages on the hill.
First-time buyers and home movers
The UK House Price Index splits buyers as well as properties. A first-time buyer in the Lewes district paid an average of £297,436 in May 2026, up 2.3% on the year. A home mover, someone selling one property to buy another, paid £449,504, up 2.8%.
The £152,068 between those two figures is the step from a first flat or terrace to a family house here, and it is a wide one, wider than the whole price of an average flat. In practice that step is what pushes buyers out of Lewes town and along the coast: a first-time buyer average of £297,436 is almost exactly the Newhaven Town median.
Buying with a mortgage cost an average of £372,129 and buying with cash £369,013, which is unusually close. In most of the South East cash buyers pay noticeably less.
How Lewes compares
| Area | Average price | Change over 12 months |
|---|---|---|
| Lewes district | £370,799 | +2.5% |
| Brighton and Hove | £403,999 | −1.4% |
| Wealden | £388,501 | −1.0% |
| Eastbourne | £250,523 | −3.8% |
| East Sussex | £316,368 | −1.0% |
| South East | £381,311 | +1.2% |
| England | £292,095 | +2.3% |
Lewes sits £54,431 above the East Sussex average and just under the South East average. The striking column is the right-hand one: every neighbouring area on that list fell over the year and Lewes rose. Eastbourne, next door, fell 3.8%.
The likeliest reason is the same one that shows up in the neighbourhood table. Lewes town is inside the South Downs National Park, most of the district’s supply is constrained, and the district is on a direct line into London Victoria that neither Eastbourne nor most of Wealden can match for frequency. When supply is fixed and demand holds, price holds.
What it means for you
If you are buying, the useful comparison is not Lewes against the England average, it is one neighbourhood against another. The same money buys a detached house in Newhaven Town or a flat in central Lewes. Check the train times and season ticket cost before you decide the coast is too far out, because Newhaven and Seaford are on a branch that needs a change at Lewes for London, and that changes the daily maths considerably.
If you are selling, you are in the rare district in this county where the twelve-month figure is positive. That is not the same as a hot market. The monthly change was −0.1%, so the rise happened earlier in the year and prices have been flat since.
If you are staying put, your home has gained value in cash terms while most of East Sussex lost it. Council tax bands were set on 1991 values and do not move with any of this.
A note on the numbers
Two different measures appear on this page and they are not interchangeable.
The UK House Price Index figures are mix-adjusted averages for the whole local authority, published monthly, and revised as late sales register. May 2026 is the most recent month available and is provisional.
The neighbourhood medians are raw medians of actual sold prices from HM Land Registry Price Paid data, published by the ONS for small areas, for the twelve months to September 2025. They are a year older and they do not adjust for the mix of property types, which is exactly why the Seaford Town figure looks the way it does.
Anything you see on a portal will be a third thing again, usually an average of current asking prices, which is not what anyone paid.
Sources
- UK House Price Index, Lewes, May 2026 (HM Land Registry)
- UK House Price Index, East Sussex, May 2026
- Housing prices in Lewes (ONS local visualisation)
- Median house prices by Middle layer Super Output Area, year ending September 2025 (ONS)
- Local Housing Needs Assessment 2025 Update (AECOM for Lewes District Council)
Have your say