
The district average hit £367,918 in June, up £6,142 in a year, while East Sussex overall fell 0.9% and Eastbourne lost £9,629. Flats were the exception.
Lewes district homes gained value over the past year while most of East Sussex lost it. The average price in the district reached £367,918 in June, according to the UK House Price Index published on 19 August by HM Land Registry. That is £6,142 more than in June 2025, a rise of 1.7%.
Across East Sussex as a whole, the average fell 0.9% over the same year. In Eastbourne it fell 3.7%, and in Hastings 4.6%.
The district’s monthly direction is less cheerful. Prices were down 0.5% on May, the third small monthly fall in a row, so the annual gain was banked earlier in the year rather than over the summer.
Where Lewes sits among its neighbours
Year-on-year change in the average price, June 2025 to June 2026:
| Area | Average, June 2026 | Change on the year |
|---|---|---|
| Rother | £343,870 | +£8,125 (+2.4%) |
| Adur | £380,031 | +£6,571 (+1.8%) |
| Lewes | £367,918 | +£6,142 (+1.7%) |
| Brighton and Hove | £407,803 | +£1,187 (+0.3%) |
| Wealden | £386,787 | -£2,897 (-0.7%) |
| Mid Sussex | £426,441 | -£3,929 (-0.9%) |
| Eastbourne | £251,811 | -£9,629 (-3.7%) |
| Hastings | £236,966 | -£11,556 (-4.6%) |
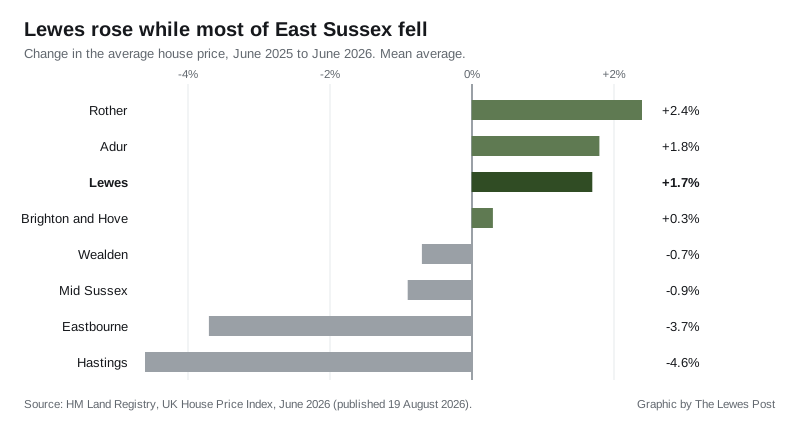
The gap along the coast is now wide. A Lewes district average buyer pays £116,107 more than in Eastbourne and £130,952 more than in Hastings. The district also sits £74,656 above the England average of £293,262, and just below the South East figure of £380,380.
Flats are the one type going backwards
Split by property type, three of the four rose over the year and one did not:
- Detached: £591,548, up £9,475 (+1.6%)
- Semi-detached: £398,016, up £10,715 (+2.8%)
- Terraced: £323,093, up £7,379 (+2.3%)
- Flats and maisonettes: £198,184, down £750 (-0.4%)
Semi-detached homes did best. Flats are the only type worth less than a year ago, and at £198,184 they are the one part of the district’s market still under £200,000.
The average paid by a first-time buyer in the district was £295,344, up £5,585 (+1.9%) on the year. A former owner-occupier paid £446,007 on average.
A word on what this figure is, and is not
Two things worth knowing before anyone reads their own house into these numbers.
The UK House Price Index average is a mean, not a median, so a handful of large sales pull it upwards. It is also a district-wide figure covering Lewes town, Newhaven, Seaford, Peacehaven and the villages, and those places do not share a price.
Sales volumes lag well behind prices in this dataset. The most recent month published for the district is April 2026, with 89 sales. There is no transaction count yet for May or June.
What it means for you
If you are selling in Lewes district, the year has been on your side but the last three months have not. The annual rise is real, and it is better than the county, but a 0.5% monthly fall means asking prices set in the spring may need looking at again.
If you are buying a flat, this is the one part of the district where the numbers moved your way, however slightly. Flats are the cheapest entry point by a wide margin: £198,184 against £323,093 for a terrace.
If you are looking across the district boundary, the arithmetic is stark. The same money goes a lot further in Eastbourne or Hastings, and both have fallen while Lewes has risen, so that gap has grown over the past year.
For the fuller local picture, including how prices break down by neighbourhood, see our Lewes house prices page. What a home sells for today has no bearing on its council tax band, which is still based on what it was worth in April 1991.
Update, 28 September 2026: HM Land Registry has since revised the June figures. The Lewes district average for June 2026 now reads £368,595, up 1.9% on the year, rather than the £367,918 and 1.7% first published and reported above. With the revision, April 2026 shows a small monthly rise, so June was the second monthly fall in a row, not the third. The July figures are in our July report.
Have your say