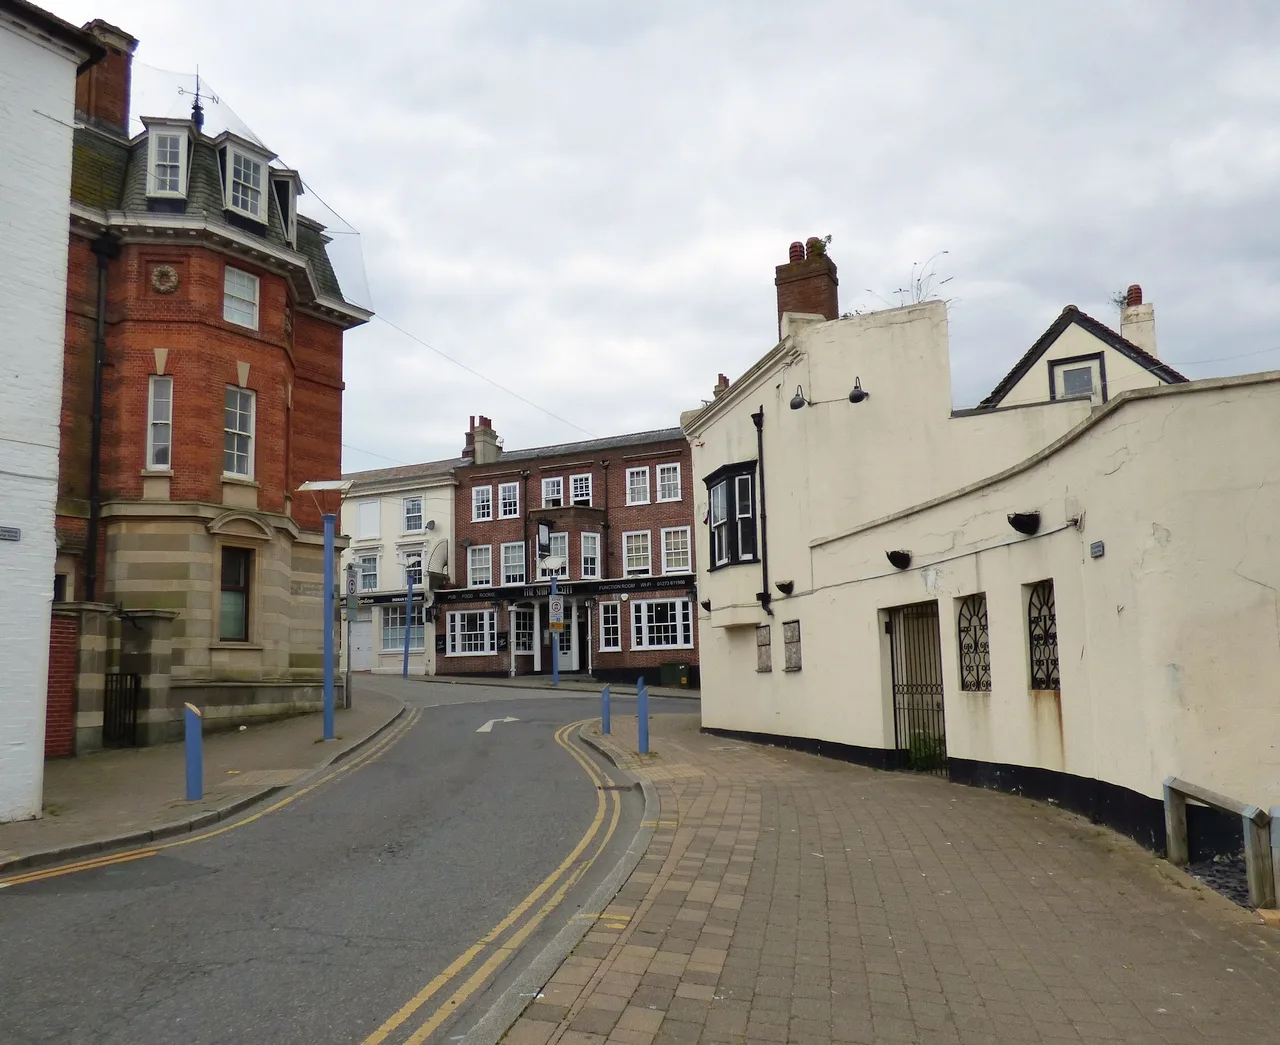

Newhaven South's claimant rate is 6.7%, above every East Sussex district average. The Lewes district had 2,055 claimants in July, up 110 in a year.
The Lewes district looks comfortable on the national numbers. In July, 3.5 per cent of its working-age residents were claiming unemployment-related benefits, against 3.9 per cent across the UK.
Split it by ward and that comfort disappears. In Newhaven South the figure is 6.7 per cent. That is higher than the average in any of the five East Sussex districts, including Hastings on 5.0 per cent and Eastbourne on 4.9 per cent. It is nearly six times the rate in Wivelsfield, 15 miles away, where it is 1.2 per cent.
All the figures here are from the ONS claimant count for July 2026, published through nomis.
One ward holds one in six of the district’s claimants
There were 2,055 claimants across the Lewes district in July, 3.5 per cent of residents aged 16 to 64. Newhaven South alone accounted for 340 of them.
The gap between the top and bottom of the district is wide:
| Ward | Claimants | Rate |
|---|---|---|
| Newhaven South | 340 | 6.7% |
| Peacehaven West | 125 | 4.5% |
| Lewes Priory | 205 | 4.5% |
| Newick | 20 | 1.3% |
| Wivelsfield | 25 | 1.2% |
Newhaven South ranks 508th of the 6,807 English wards with a published rate, putting it in the highest eight per cent in the country.
Grouped by town, the coastal strip carries most of the district’s total. Peacehaven and Telscombe together account for 510 claimants, Newhaven 455, Lewes town 410, Seaford 360, and the villages 315.
Ward figures are rounded to the nearest five, which is why the 21 wards add to 2,050 rather than the district’s 2,055. The ward series only starts in January 2026, so there is no year-ago comparison at this level. Since January, the sharpest proportional rise has been in Chailey, Barcombe and Hamsey, up from 60 to 75, while Ouse Valley and Ringmer fell from 135 to 125.
The district rose faster than the country, but not as fast as its neighbours
The Lewes total was 1,945 in July 2025. It is 2,055 now, a rise of 110, or 5.7 per cent. That is the highest monthly figure since February 2025.
Set against the wider picture:
- United Kingdom: up 1.3 per cent in the year
- South East: up 3.3 per cent
- East Sussex: up 6.7 per cent
- Lewes district: up 5.7 per cent
Within the county, Lewes sits in the middle. Wealden rose fastest at 9.7 per cent, then Hastings at 7.4 per cent, then Lewes, Rother at 5.5 per cent and Eastbourne at 4.9 per cent.
It is not a young people’s story here
Elsewhere in the South East this year, the increase has been driven by people under 25. In the Lewes district it has not been.
Claimants aged 16 to 24 rose from 380 to 420, a rise of 10.5 per cent. That is the second mildest of the five East Sussex districts, and well below the county’s 13.0 per cent. Wealden’s under-25 count rose 17.6 per cent over the same year.
The largest increase in raw numbers was among people aged 25 to 49, up from 1,070 to 1,115. Claimants aged 50 and over rose from 490 to 520.
What it means for you
The claimant count is not the unemployment rate. It counts people claiming Jobseeker’s Allowance, plus Universal Credit claimants who are required to look for work. Someone working part time on a low income can be in it. Someone unemployed but not claiming is not.
That makes it a rough measure, but a fast and local one. It is published monthly, roughly five weeks behind, and it goes down to ward level, which the official unemployment survey does not.
The practical reading for this district: the headline rate tells you very little about where you live. A resident of Wivelsfield, Newick or Ditchling is in a labour market that looks nothing like the one in Newhaven South or Peacehaven West, and district-wide averages hide both.
The next release, covering August 2026, is due in mid-September.
Sources
- Claimant count, July 2026, Lewes district and wards (ONS via nomis, dataset NM_162_1)
- Claimant count by age and by local authority (ONS via nomis)
Related: Lewes house prices and planning applications in the district.
Update, 16 September 2026: the ONS has since revised the July 2026 figures. The district total is now 2,010 rather than 2,055, so the rise on July 2025 is 65 (3.3 per cent) rather than 110. Some ward and age figures moved too; Lewes Priory, for example, is now 185 rather than 205. The figures above are as published at the time. The August figures, on the revised basis, are in our August claimant count story.
Have your say