
2,065 people claimed in the Lewes district in September, up 95 in a month and the sharpest rise in East Sussex. Women make up 90 of the 95 added in a year.
2,065 people were claiming unemployment-related benefits in the Lewes district in September 2026. That is up 95 on August, a rise of 4.8 per cent in a single month.
It is the highest count since February 2025, when it reached 2,075. No other district in East Sussex rose as fast between August and September.
The figures are from the ONS claimant count, published through nomis on 20 October. All counts are rounded to the nearest five.
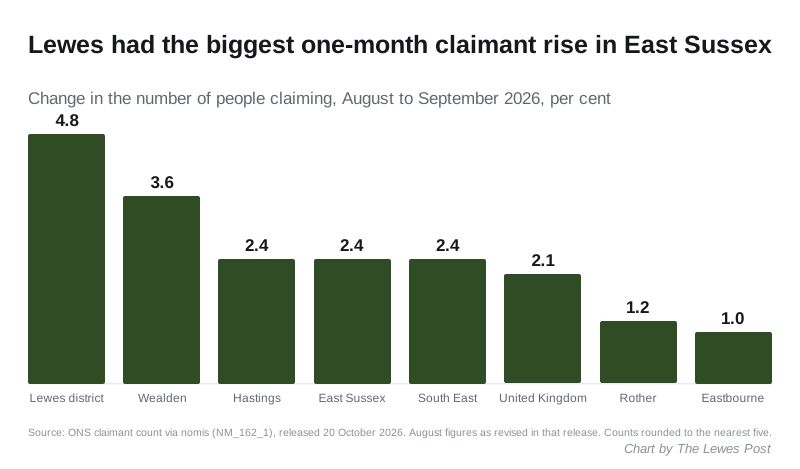
The sharpest monthly rise in the county
Change in the number of claimants, August to September 2026:
| Area | August 2026 | September 2026 | Change |
|---|---|---|---|
| Lewes district | 1,970 | 2,065 | +95 (4.8%) |
| Wealden | 2,240 | 2,320 | +80 (3.6%) |
| Hastings | 2,720 | 2,785 | +65 (2.4%) |
| East Sussex | 11,485 | 11,765 | +280 (2.4%) |
| South East | 182,020 | 186,430 | +4,410 (2.4%) |
| United Kingdom | 1,667,095 | 1,702,905 | +35,810 (2.1%) |
| Rother | 1,620 | 1,640 | +20 (1.2%) |
| Eastbourne | 2,930 | 2,960 | +30 (1.0%) |
One caution on the size of the jump. ONS has revised August down. Our August story reported 2,015, the figure published at the time. The revised figure is 1,970. Measured against the figure first published, September’s rise would have been 50, not 95.
Over the year the picture is milder. The count is up 95 on September 2025, when it was 1,970. That is 4.8 per cent, below the county’s 6.3 per cent:
- Wealden: up 205 (9.7 per cent)
- Hastings: up 205 (7.9 per cent)
- Rother: up 95 (6.1 per cent)
- Lewes district: up 95 (4.8 per cent)
- Eastbourne: up 105 (3.7 per cent)
As a share of residents aged 16 to 64, the district rate is 3.6 per cent, up from 3.4 per cent a year ago. The county is on 3.7 per cent, the South East on 3.1 and the UK on 3.9. Within East Sussex, Hastings is highest at 5.0 per cent and Wealden lowest at 2.5.
Almost the whole yearly rise is women
The number of women claiming rose from 825 to 915 over the year, up 90. The number of men went from 1,145 to 1,150.
Between August and September alone, women rose by 60 and men by 30.
By age, comparing September 2025 with September 2026:
| Age | September 2025 | September 2026 | Change |
|---|---|---|---|
| 16 to 24 | 395 | 445 | +50 (12.7%) |
| 25 to 49 | 1,080 | 1,110 | +30 |
| 50 and over | 495 | 510 | +15 |
The 50-and-over figures are our subtraction of the two younger groups from the total, so they carry the rounding of all three.
Where the claimants are
Newhaven South is still the district’s highest ward, with 345 claimants and a rate of 6.8 per cent. That is up from 330 in August. It is higher than the average for any East Sussex district, including Hastings. Its highest month this year was March, at 350.
Grouping the 21 wards by town, August to September:
- Peacehaven (East, North and West wards): 350 to 370
- Seaford (five wards): 355 to 380
- Newhaven (North and South): 440 to 450
- Lewes town (Bridge, Castle and Priory): 415 to 425
Peacehaven West, at 4.7 per cent, now has the second-highest rate in the district. The lowest rates are in Wivelsfield and Newick (both 1.4 per cent) and Ditchling and Westmeston (1.5 per cent).
The ward figures add to 2,060 rather than 2,065. That gap is the rounding. Ward counts move in fives, so a change of five or ten in one month is not a trend.
What it means for you
The claimant count is not the unemployment rate. The ONS says it “does not attempt to measure unemployment”. It counts people claiming benefits principally because they are unemployed. Since Universal Credit, that includes some people in low-paid work who are required to look for more hours.
For the district, the practical reading is:
- One month is a warning, not a trend. Part of the jump comes from August being revised down. October’s figures will show whether 2,065 holds.
- The rise is among women and young people. Claims by women are up 11 per cent in a year. Claims by under-25s are up 13 per cent.
- The coast carries most of it. Newhaven, Peacehaven and Seaford wards hold more than half the district’s claimants.
The October figures are due from ONS in November.
Related: Lewes house prices, council tax bands and planning applications in the district.
Sources
- ONS claimant count, September 2026, Lewes district, wards, East Sussex districts, South East and UK (nomis dataset NM_162_1, updated 20 October 2026)
- ONS: Claimant Count quality and methodology information
Have your say